Overview Tab
Monitor high-level platform metrics including companies, users, revenue, and recent activity.
The Overview tab provides a bird's-eye view of your travel platform's health and activity. It's designed to give you a quick snapshot of key metrics without diving into detailed reports.

Statistics Cards
At the top of the Overview tab, you'll see summary statistics.
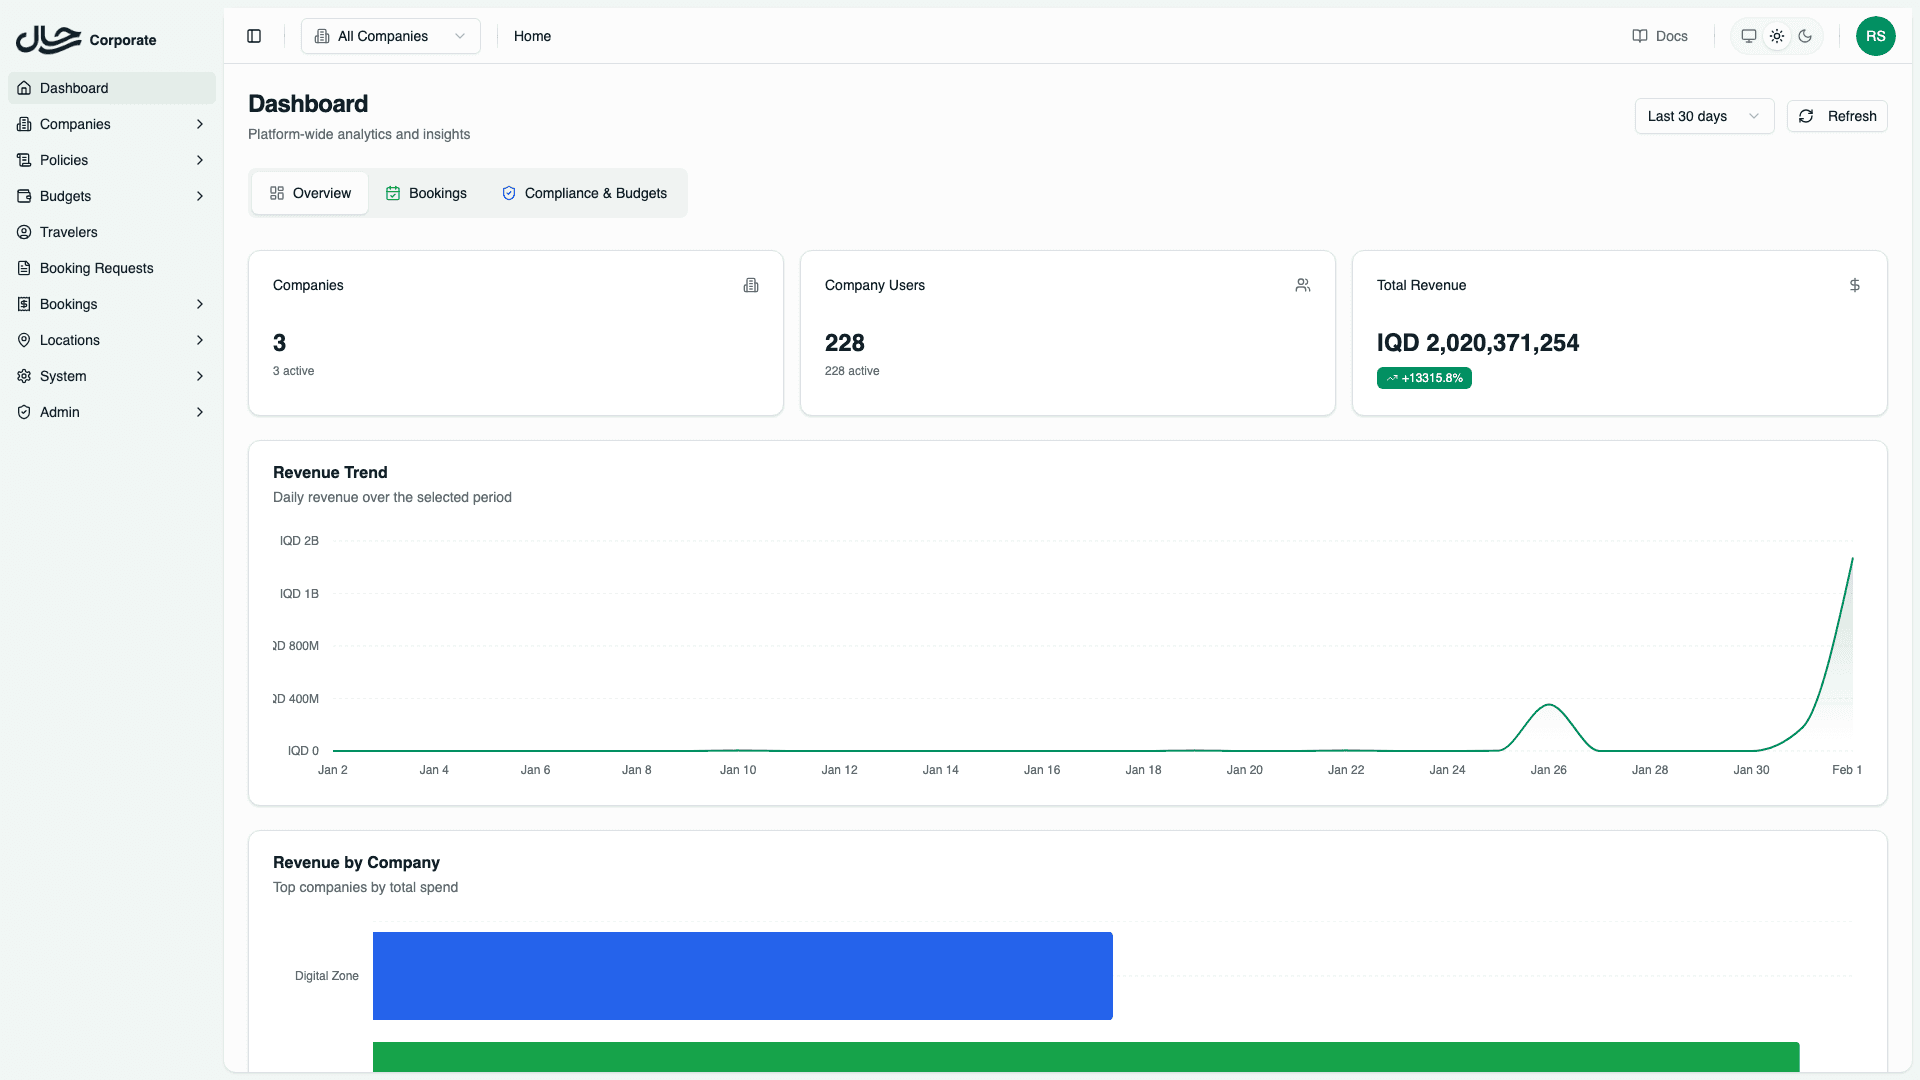
All Companies View
When viewing all companies, you see:
| Card | Metrics |
|---|---|
| Companies | Total companies, Active companies |
| Company Users | Total users, Active users |
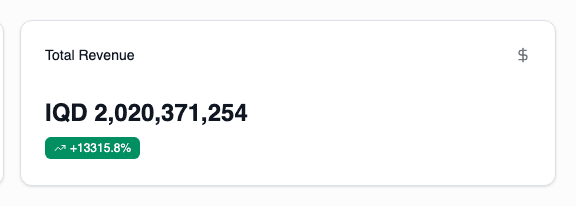
| Total Revenue | Revenue amount with trend indicator |
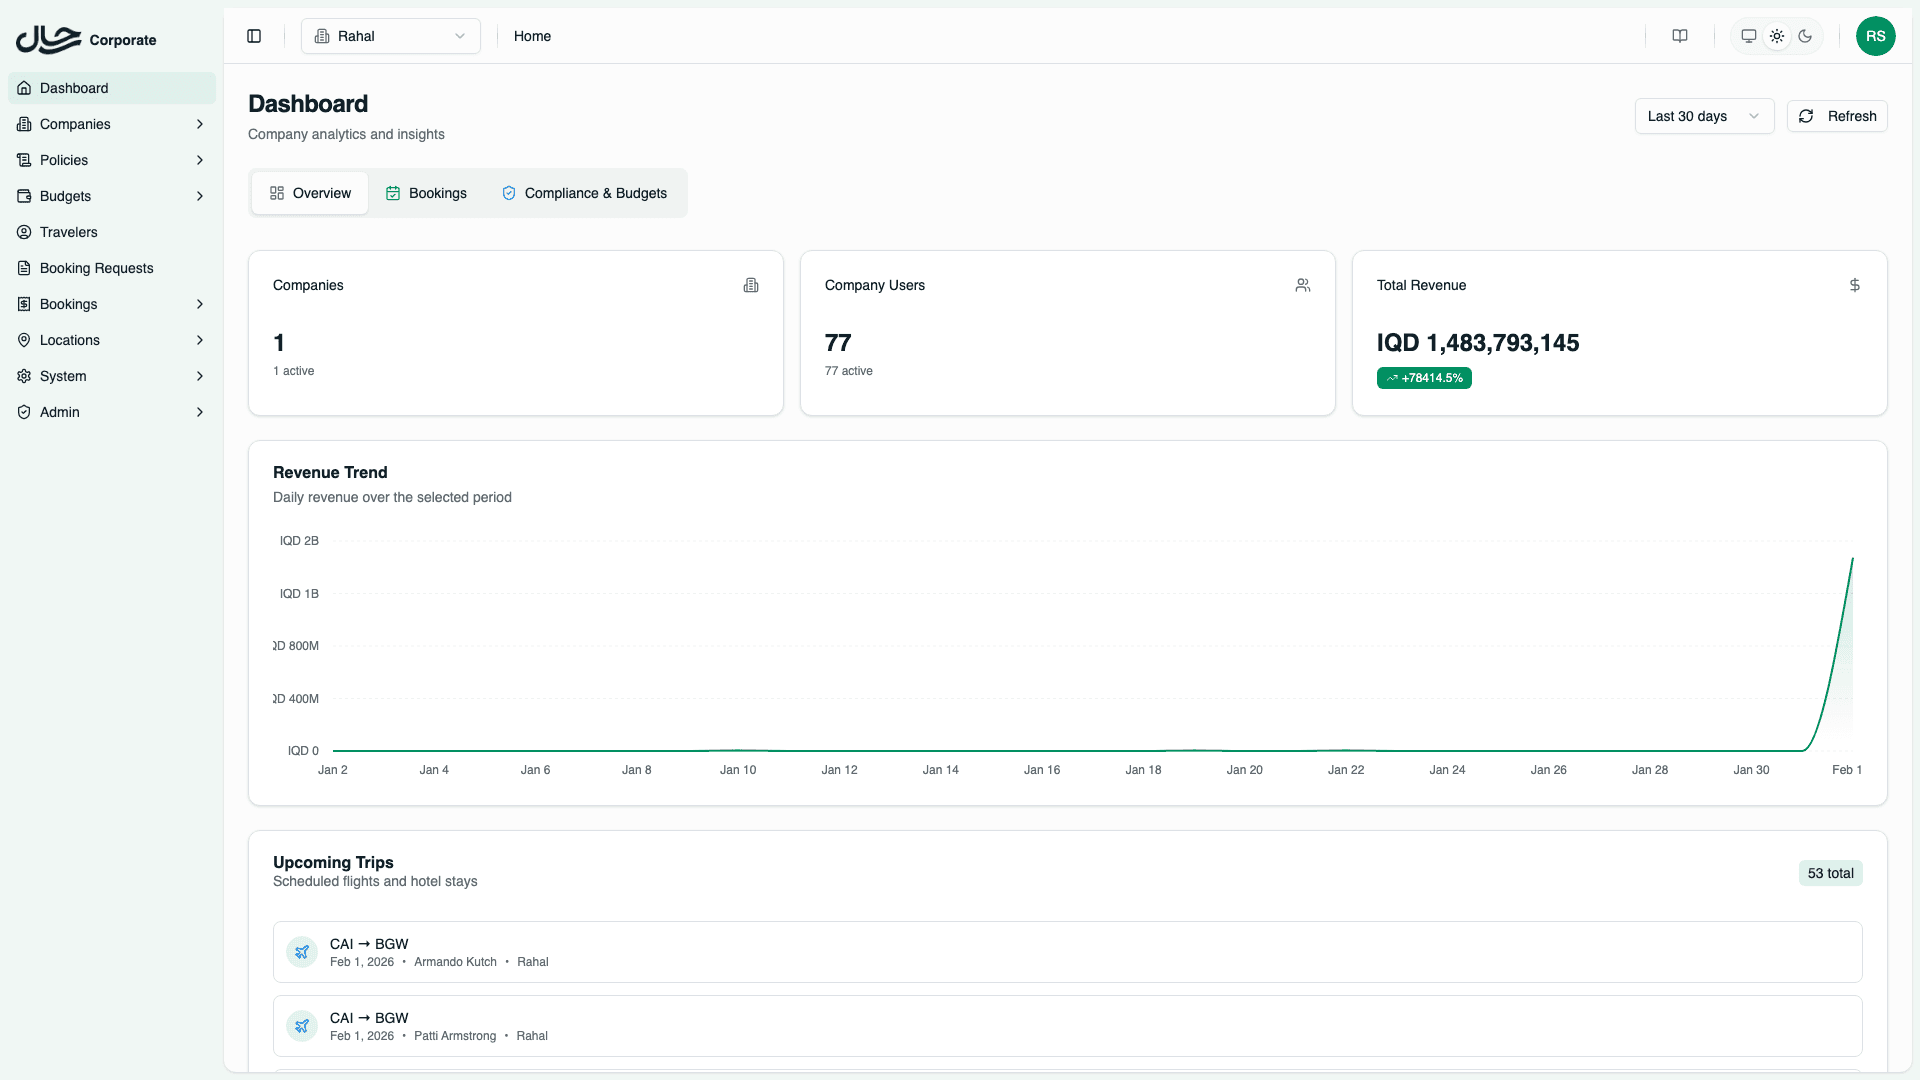
Single Company View
When a specific company is selected:
| Card | Metrics |
|---|---|
| Company Users | Total users, Active users for that company |
| Total Revenue | Revenue for that company with trend |
Trend indicators show the percentage change compared to the previous period of equal length.
Revenue Chart
The revenue area chart displays daily revenue over the selected date range.
This helps identify:
- Revenue patterns and trends
- Seasonal fluctuations
- Impact of policy or budget changes
Revenue by Company (Platform Admins Only)
When viewing all companies, a horizontal bar chart shows revenue distribution across companies. This chart is hidden when viewing a single company.
Use this to identify:
- Top-performing companies by revenue
- Revenue concentration across your client base
- Companies that may need attention
Upcoming Trips
The upcoming trips table shows the next scheduled flights and hotels.
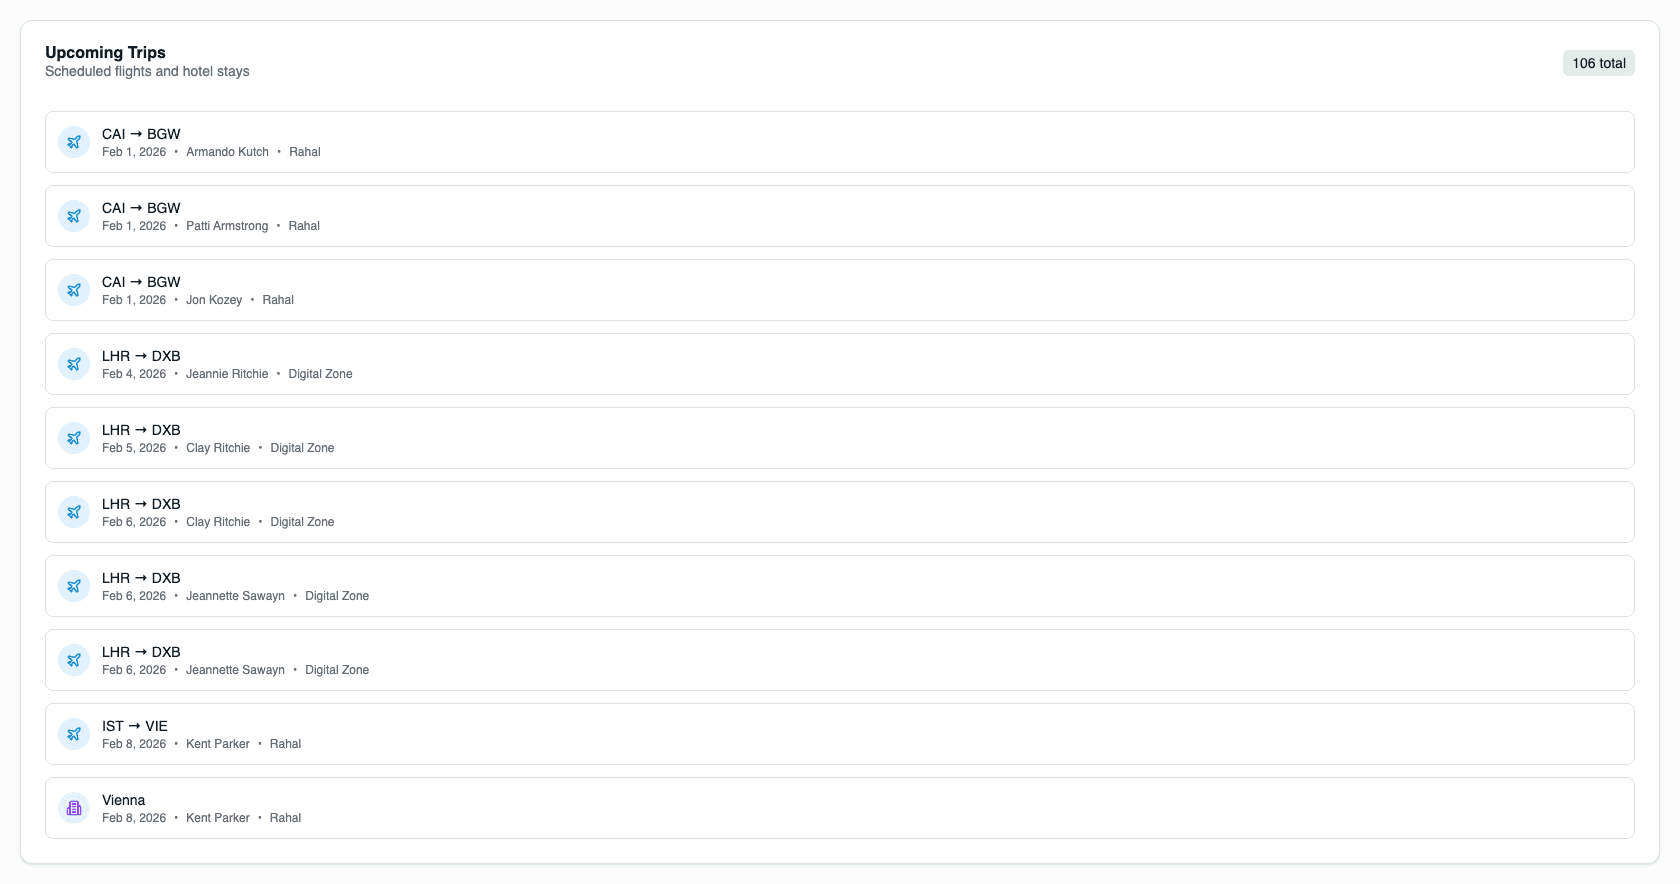
Each entry includes:
- Traveler name
- Service type (flight or hotel)
- Destination
- Date
- Company (in all companies view)
This helps you:
- Stay aware of imminent travel
- Identify potential issues before travel dates
- Track active travel periods
Recent Activity Feed
The activity feed shows recent actions across the platform.
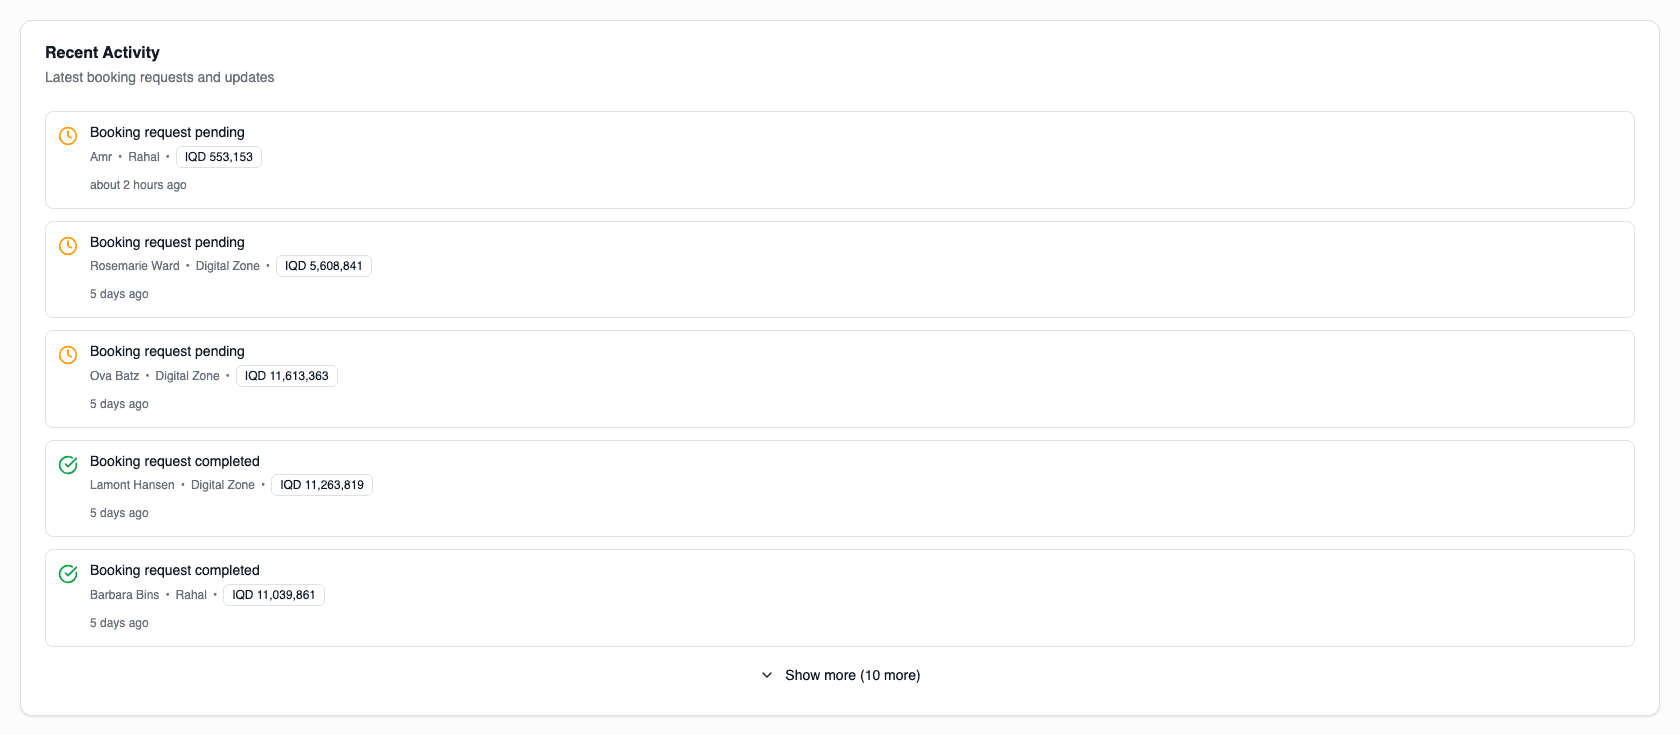
Examples include:
- New booking requests submitted
- Bookings confirmed or cancelled
- Policy violations triggered
- Budget thresholds reached
Click "View All" to see an expanded list of recent activity.
Reading the Data
When All Companies is Selected
- Statistics reflect platform-wide totals
- Revenue chart shows aggregated revenue
- Revenue by company chart is visible
- Upcoming trips show company badges
- Activity feed includes all company events
When a Company is Selected
- Statistics are filtered to that company
- Revenue chart shows only that company's revenue
- Revenue by company chart is hidden
- Upcoming trips show only that company's travelers
- Activity feed shows only that company's events