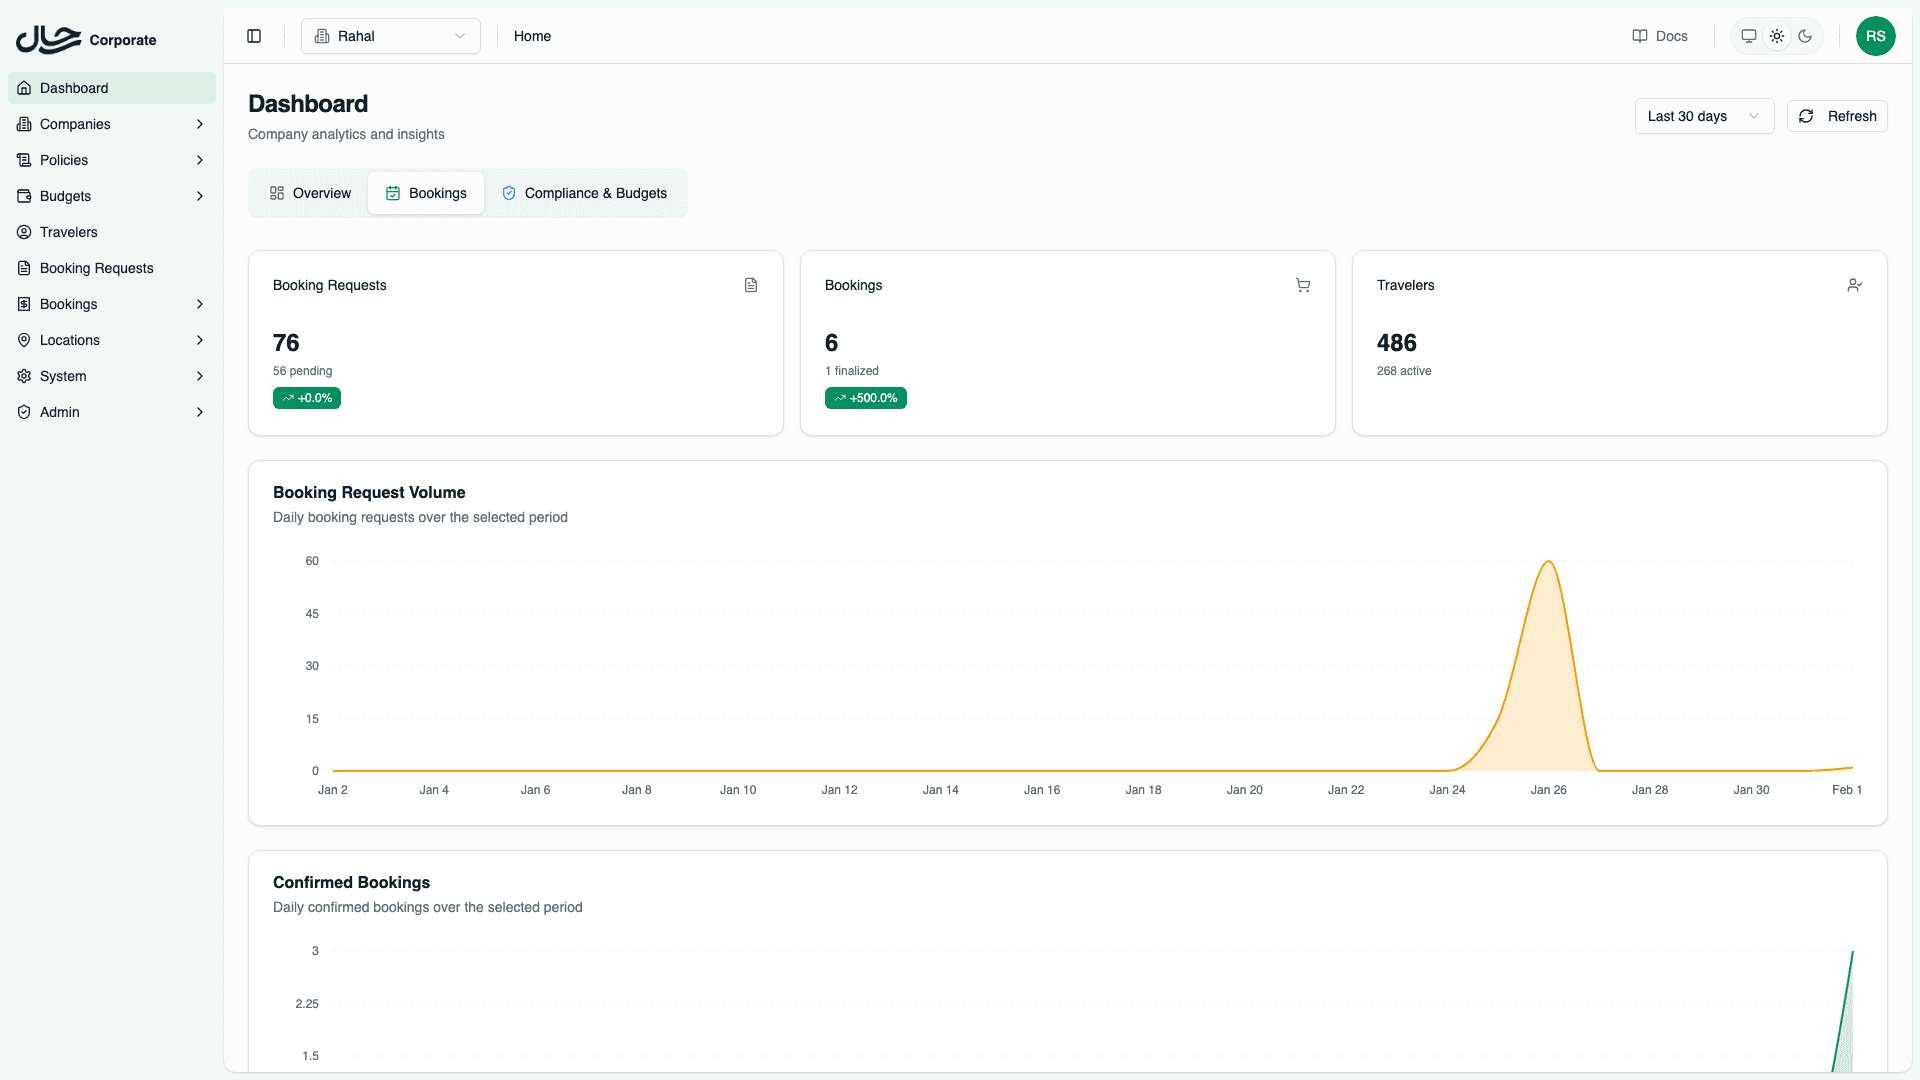
Bookings Tab
Analyze booking request volumes, order statuses, service breakdowns, and popular routes.
The Bookings tab provides detailed analytics on travel activity, helping you understand booking patterns, identify trends, and spot potential issues.
Statistics Cards
The top of the Bookings tab displays three summary cards.
| Card | Metrics |
|---|---|
| Booking Requests | Total requests, Pending count, Trend % |
| Bookings | Total orders, Finalized count, Trend % |
| Travelers | Total travelers, Active travelers |
Active travelers are those with at least one booking in the selected date range.
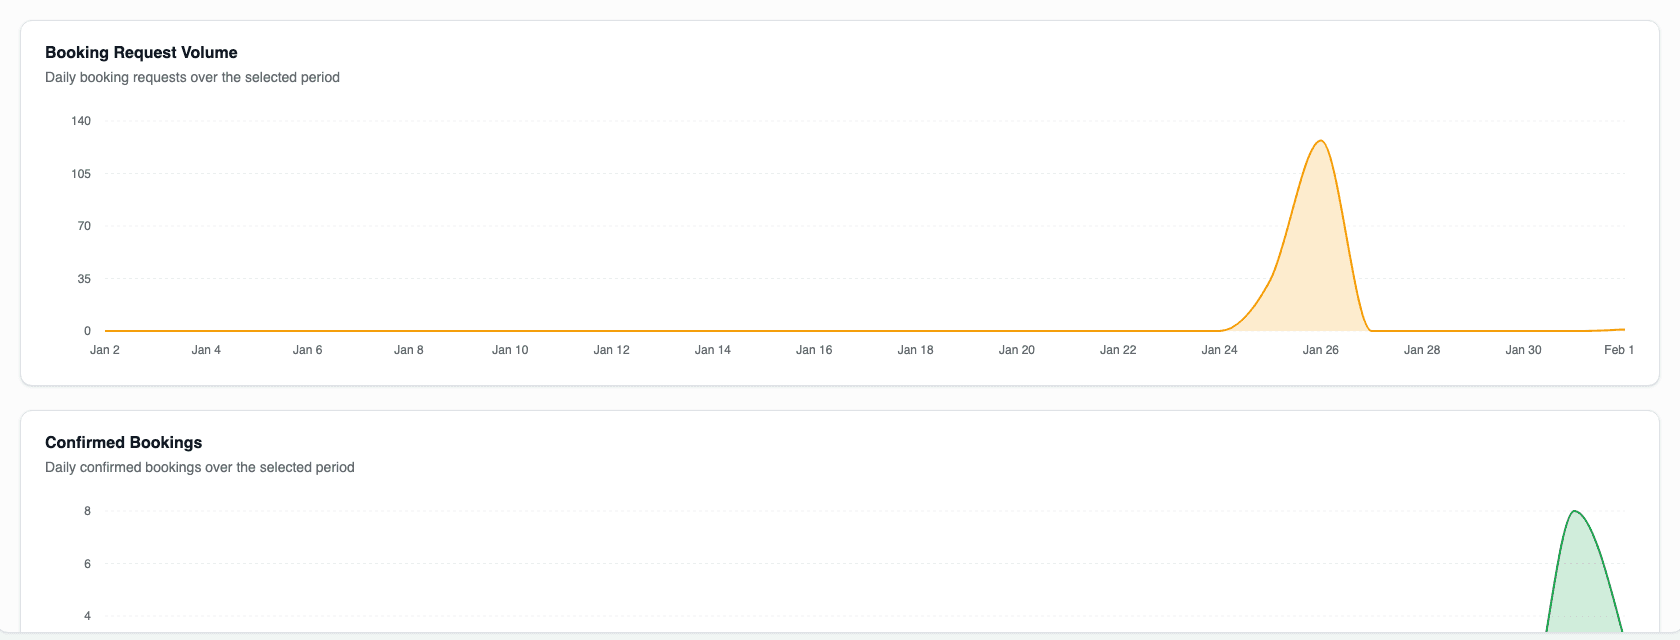
Volume Charts
Two area charts show daily volumes.
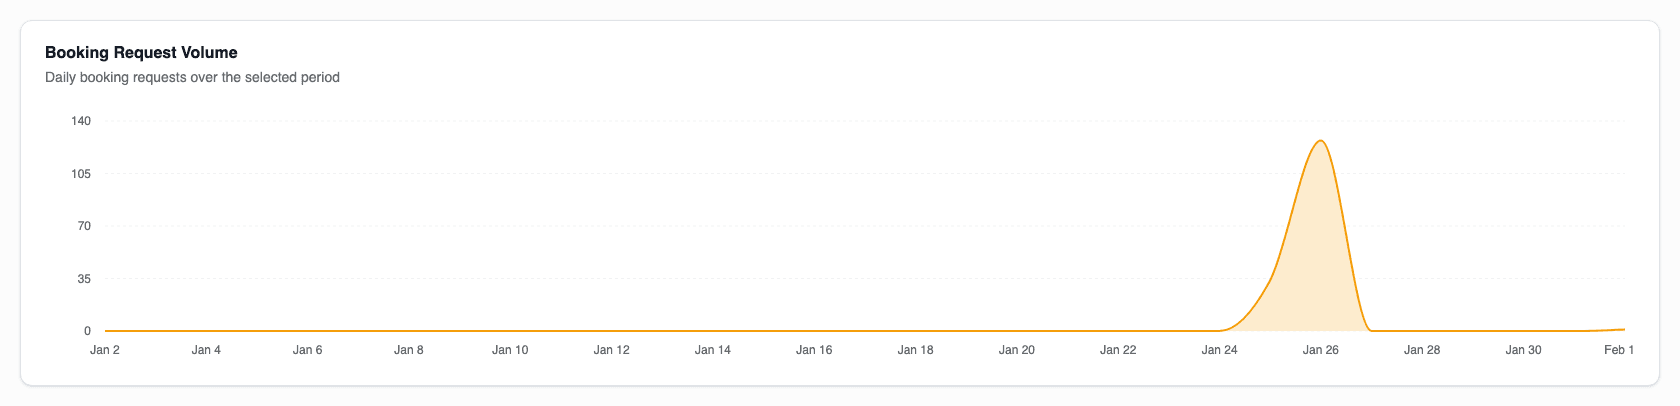
Booking Request Volume
Displays daily booking request submissions. Use this to identify:
- Peak request days (often Mondays or after holidays)
- Seasonal travel planning patterns
- Impact of policy changes on request volume
Booking Volume
Shows daily confirmed bookings. Compare with request volume to understand:
- Conversion from requests to bookings
- Processing delays or bottlenecks
- Approval workflow efficiency
Status Distribution
Two pie charts break down statuses.
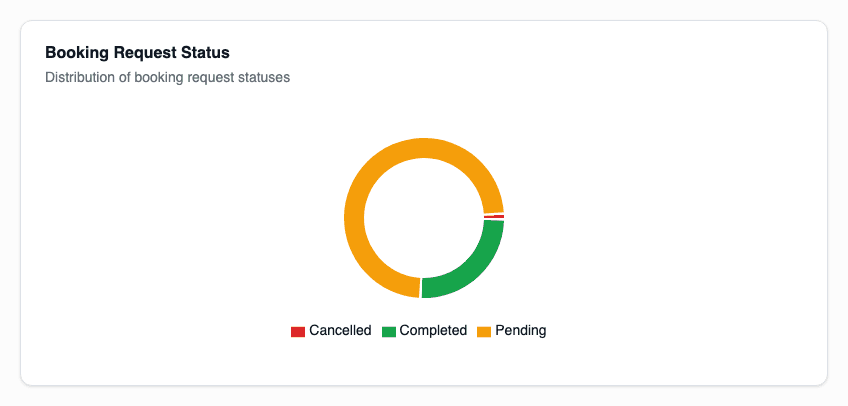
Booking Request Status
Shows the distribution of booking requests by status:
- Pending - Awaiting approval or processing
- Completed - Successfully processed into bookings
- Cancelled - Cancelled before completion
Booking Status
Shows the distribution of orders by status:
- Paid - Payment completed
- Finalized - Booking confirmed with provider
- Pending - Awaiting payment or confirmation
- Cancelled - Cancelled after creation
Service Breakdown
A pie chart shows the split between service types.
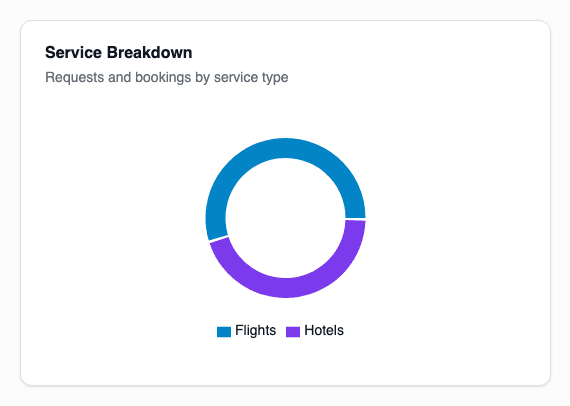
- Flights - Percentage and count of flight bookings
- Hotels - Percentage and count of hotel bookings
- Packages - Combined flight and hotel bookings (if applicable)
This helps you understand:
- Primary travel needs of your organization
- Balance between air and lodging spend
- Trends in service preferences
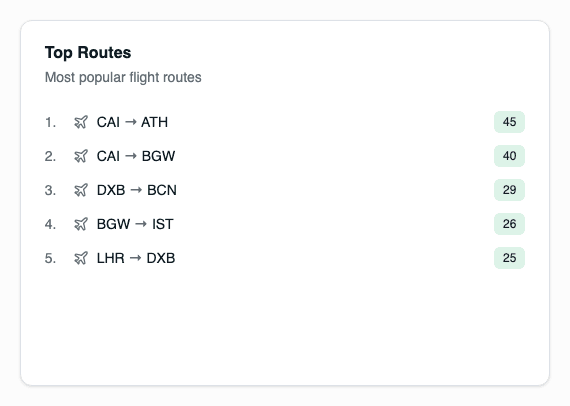
Top Routes
The top routes table shows the most popular flight routes.
| Column | Description |
|---|---|
| Route | Origin and destination city pair |
| Bookings | Number of bookings on this route |
| Revenue | Total revenue generated |
Use this to:
- Negotiate corporate rates on popular routes
- Identify opportunities for preferred carrier agreements
- Understand travel patterns by destination
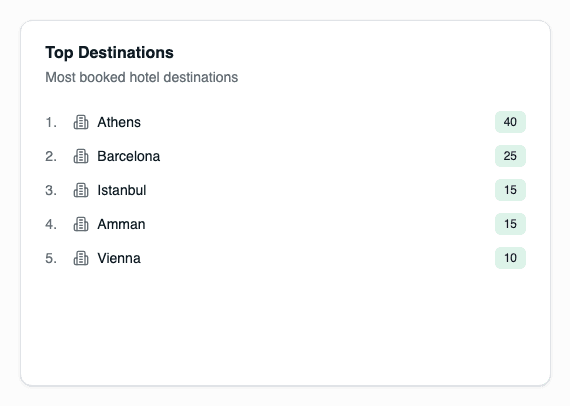
Top Destinations
The top destinations table shows the most popular hotel locations.
| Column | Description |
|---|---|
| Destination | City or area |
| Bookings | Number of hotel bookings |
| Nights | Total room nights |
Use this to:
- Negotiate corporate hotel rates
- Identify travel hubs for your organization
- Plan location-based policies
Filtering Behavior
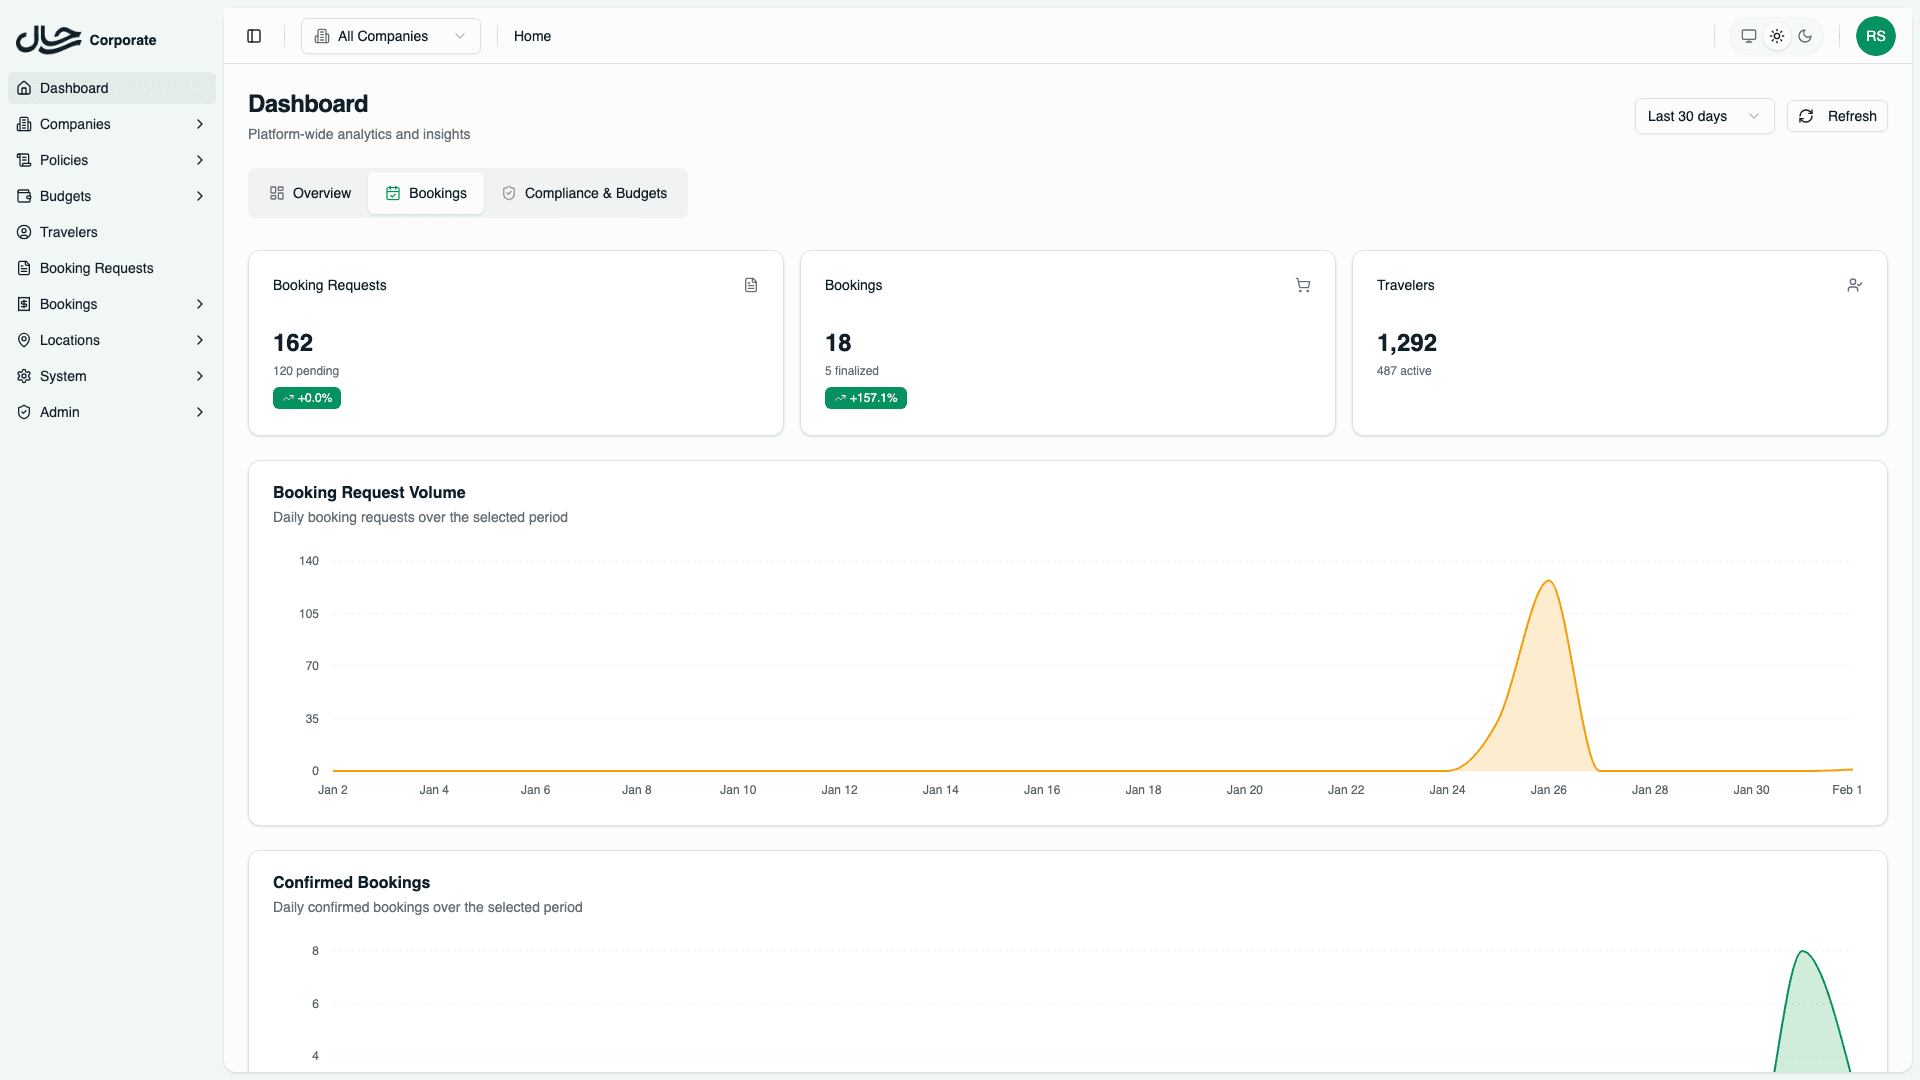
All Companies View
- All statistics reflect platform-wide totals
- Charts include all companies' data
- Top routes and destinations aggregate across companies
- Company badges may appear in detailed views
Single Company View
- Statistics filtered to selected company
- Charts show only that company's data
- Top routes and destinations specific to that company
- Useful for company-specific negotiations and planning